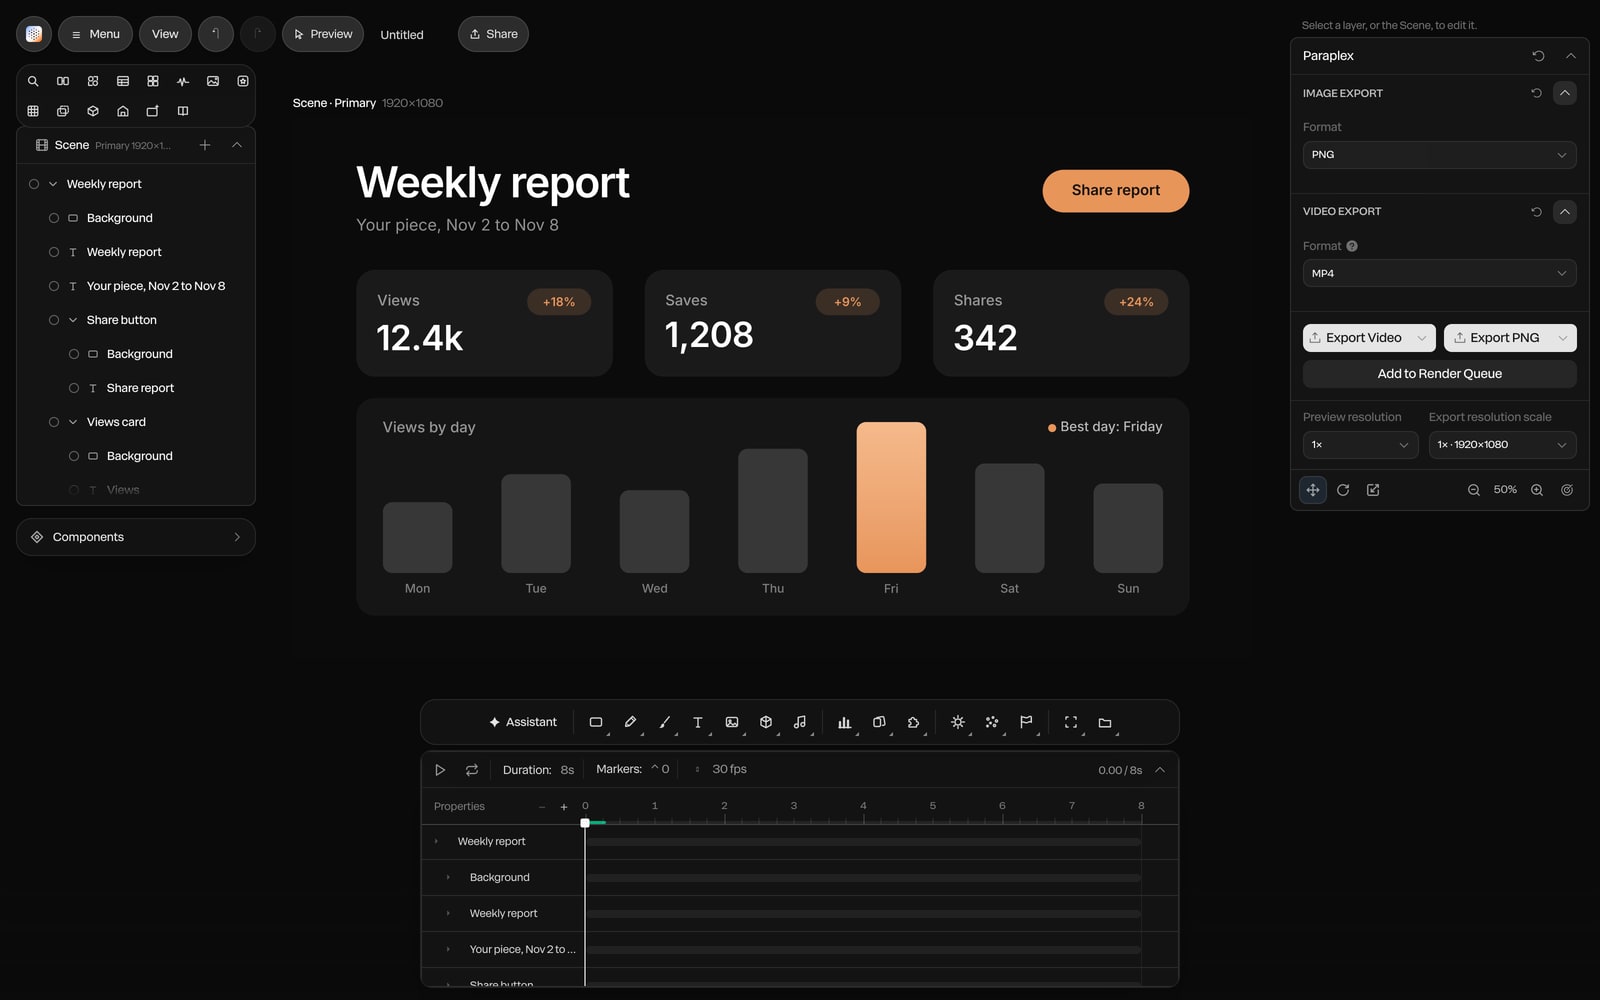
Concept render

Live code, inside the scene.
Paste HTML, a React component or a shadcn/ui component as a code layer. Inside an embed it runs live and responds to the pointer.
Turn a stat, a report or a quarter's results into a short data video: charts that build themselves, counters that roll to the figure, pictographs people can count, and a voice that walks through it with captions timed to every word. Every bar, icon and label is a layer in real 3D, and one scene exports for LinkedIn, YouTube, your deck and the vertical feed.
Unlimited free 1080p exports. No watermark. Runs in your browser.













Paste a CSV or upload the file, pick a chart, and Paraplex builds it and animates it in: bar, line, area, pie, donut, scatter, Gantt or timeline. Bars grow, lines draw on and slices sweep open. It reads numbers the way people write them, so "$1,200" and "45%" come through as values, and a chart takes up to 400 rows. When the numbers change, Edit data & regenerate rebuilds it.
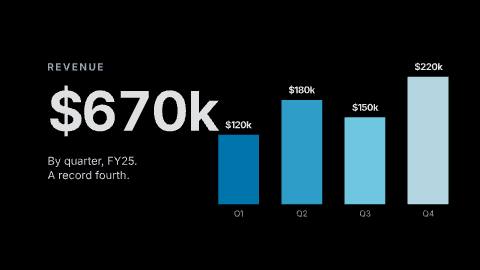
Every bar, label and axis stays its own layer, so you can give the bars depth and a material, paint the one that matters in your accent color, or land each label just after its bar. The Chart drop template is playing here, as a revenue total counts up beside four growing bars.
More on animated charts.
Some numbers land harder as a count. Turn any text into a counter that runs to its figure as a smooth Counter, a rolling Odometer or a running Clock, with decimals, thousands separators and a "$" or "%" built in.
Unit charts show a share as things people can count: people, coins, pills, paper, dots or blocks, in a row, column, grid or pile. Key the Value and units arrive one by one; key the Highlight and a share lights up, with a counter riding on top as it grows. For bigger data, a particle cloud places one particle per row of a spreadsheet, up to 10,000 of them.

Unit chart · coins pile up to split a budget
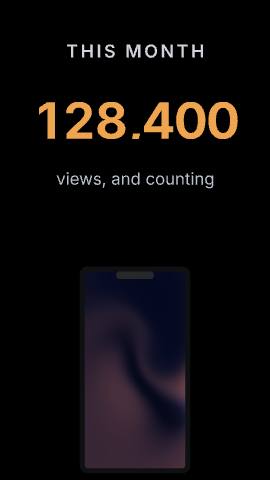
Counter · a figure rolls in on the beat
Data cloud · one particle per row
Not every data story is a chart. Draw a diagram freehand, in strokes that look like pencil, charcoal or paint, and let it draw on over time; lay out a plan as a Gantt or timeline chart; paste icons in as SVGs; and label each part with one of 40+ text presets that animate by character, word or line.
Group the parts into a grid or a row and let them build in one by one, so a how-it-works explainer arrives one idea at a time. The Whiteboard explainer template is playing here, as a marker sketches a workflow and a lightbulb lights amber.

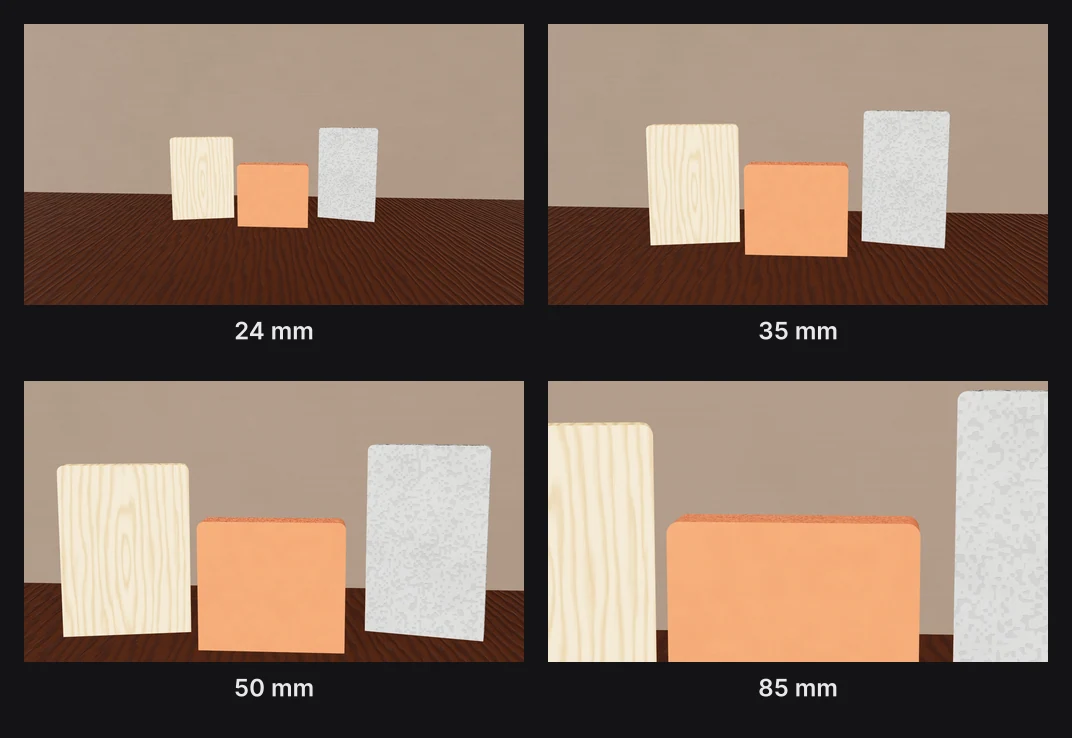
Eight camera moves are written for you from the playhead: Push in, Pull back, Pan, Tilt, Orbit, Whip, Dolly zoom and Rack focus. Frame the bar or the figure that carries the story, set the seconds and a curve, springs included, and chain moves so the shot leans in, holds and eases back out for the next point.
Depth of field softens everything but the number you're talking about, and studio lights, shadows and materials make a chart look photographed rather than pasted in. The Voice AI launch template is playing here, as the camera dives into a 3D benchmark chart.

Type a script, pick an ElevenLabs voice and a pace, and the voiceover lands as an audio track with a caption on each word, timed from the voice itself. Caption styles include Shorts, Documentary, Subtitle and Spoken, where each word lights up as it's said, and the captions export as SRT or WebVTT for YouTube and other players.
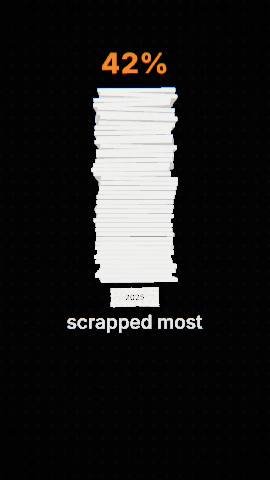
Describe a soft whoosh or a music bed and it arrives as its own track, and Detect beats marks every beat of the music so each figure can land on a hit. The AI ROI gap template is playing here: a narrated Short that shows forty billion dollars as a pile of paper and splits a budget into coins.
More on AI voiceovers.
When the same story has to be told twelve times, once per region, client or team, import a spreadsheet and Paraplex makes one version per row, matching columns to layers by name: the headline, the figure, the photo. On Pro, Export all variants renders every version in every format you've turned on, in one job you can stop and resume.
A data video tells one story well; data-driven video makes that story once for every row. The two work together: build the recap here, then let your data fill in each version.
More on data-driven video.
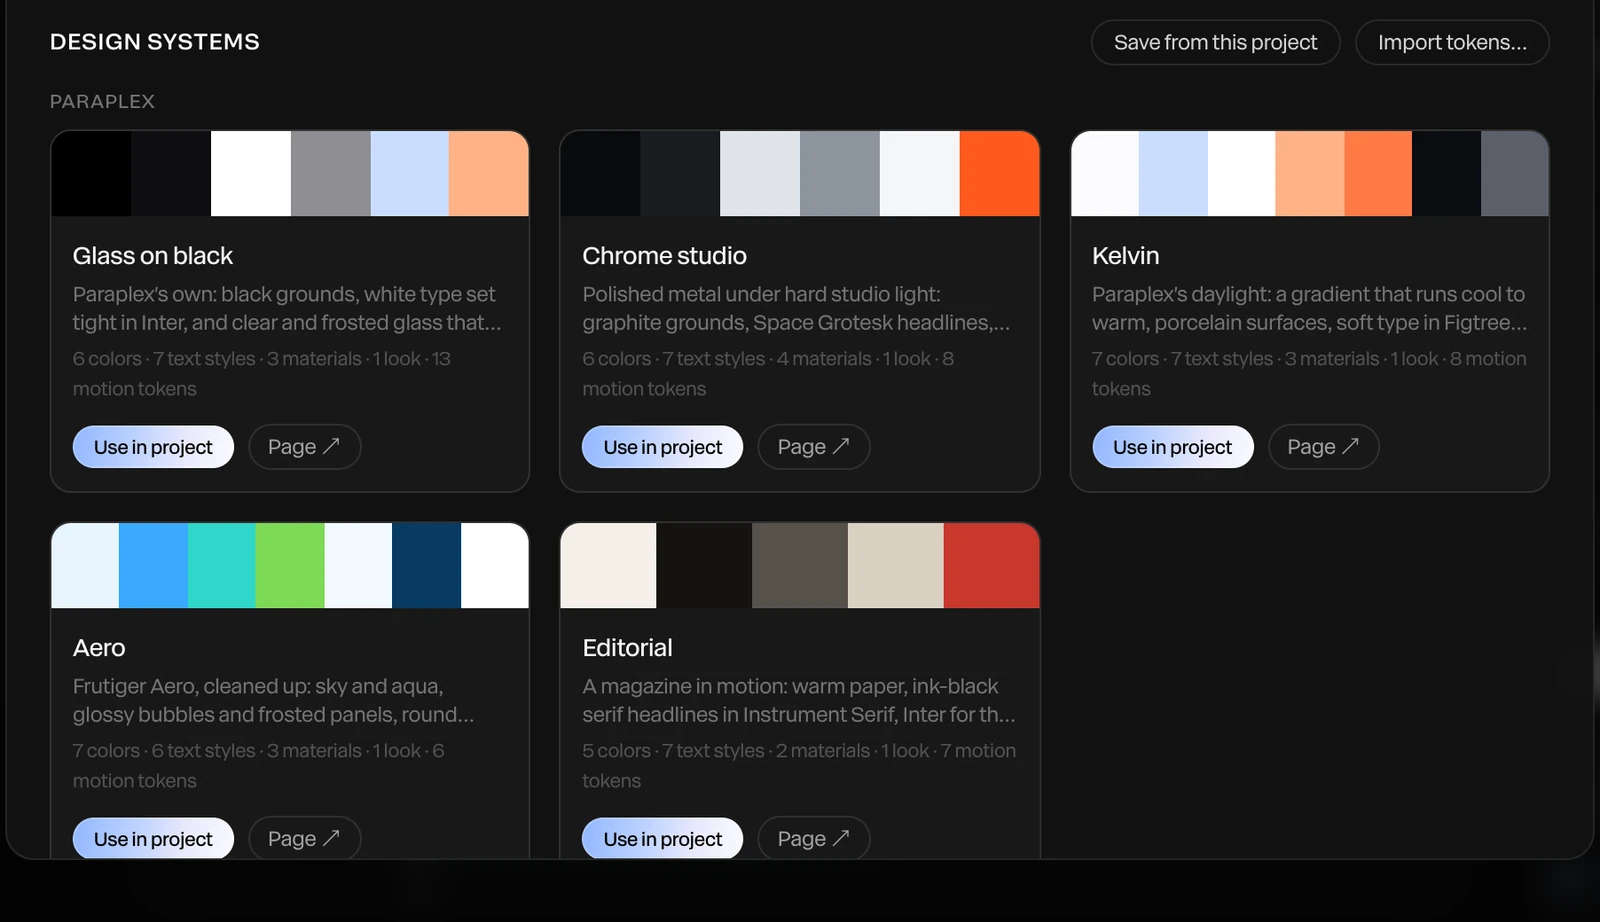
Keep your colors, fonts, text styles, materials and motion curves in a design system and apply it to any data video in one step, so a quarterly recap looks like the rest of your reports. Apply with AI has the assistant restyle a template in your brand.
Palette themes switch a whole scene between light and dark in one choice, so the same chart works on a dark slide and on a white report page.
More on design systems.
Add formats as artboards beside your frame and Responsive framing re-stacks the chart, the counter and the caption for each shape, with your logo pinned to its corner. Slides take a 16:9 or 4:3 export, and safe zones show where TikTok, Reels, Shorts and the Instagram feed put their buttons, so the number stays clear of them.
Export to
5 shapes
16:9, 9:16, 1:1, 4:5 and 4:3, or a custom size
Each piece runs up to
1 hour
at 10 to 120 fps, from a single stat to a full report video
Up to
4K at 60 fps
on Pro; free exports run to 1080p, no watermark
Landscape 16:9 · your site, YouTube and slides
Vertical 9:16 · Reels, Shorts and TikTok
Portrait 4:5 · LinkedIn and X feeds
A data video has one job: make a figure stick before people scroll on. These are the parts of Paraplex that help, beyond the charts and counters above.
400
rows per chart from a CSV, with values written like "$1,200" or "45%" read as numbers
10,000
rows in a 3D data cloud, one particle per row, placed by its X, Y and Z columns
Typewriter text with a blinking cursor, which deletes like a backspace as its exit
Counters, odometers and clocks, with $ or % built in
Text swaps that turn one phrase into the next while the shared words stay put
Grid and Flex layouts, written like CSS, that animate when a card arrives or leaves
Bento layouts that build a keynote-style grid tile by tile
Smart guides, an 8-point grid and one-pixel nudges in 2D mode
MP4 and WebM, every frame rendered at full quality
Transparent WebM or a PNG sequence on Pro, to lay a chart over footage or a slide
PNG or JPG stills of any frame, and GIFs small enough to post
Hand the assistant a CSV and a sentence, and it builds the scene from real layers you keep
Paste an SVG icon or a logo straight onto the canvas
Attach a reference video and the assistant reads it as a storyboard to match its timing
Infographic templates you open, retype and make your own
A 14 to 200 mm lens, with focus pulls you can keyframe
Studio lighting, HDRIs and reflective floors for 3D charts
Generate a 3D model from a sentence to stand in for a product or a place
3D text in chrome or glass for the headline figure
Each template opens with every layer, keyframe, light and camera move ready to edit.
Open Paraplex in your browser and start from an infographic template such as Dot lattice or Chart drop, or describe the video to the assistant. Paste your numbers or upload a CSV to build charts, turn any figure into a counter, show shares as unit charts, then export an MP4 in 16:9, 9:16, 1:1 or 4:5. Every bar, icon and label stays a layer you can edit.
A short video that explains numbers with motion: charts that build on screen, counters that roll to a figure and pictographs that show a share as things you can count, often with a voiceover and captions. People make them for social feeds, YouTube, presentations, reports and investor updates.
An animated chart is one chart built from one dataset. A data video tells a story with several of them, plus counters, pictographs, words and often a voice. Data-driven video takes one template and makes a version for every row of a spreadsheet, such as one per region or client. Paraplex does all three, and they combine.
Yes. Make the scene once, add the shapes you want to post, such as 1:1 or 4:5 for the feed and 16:9 for a wide post, and export an MP4 of each. Free exports run to 1080p with no watermark; Pro adds 4K at 60 fps.
Yes. Type a script, pick an ElevenLabs voice and a pace, and the voiceover arrives as an audio track with a caption on each word, timed from the voice. You can export the captions as SRT or WebVTT for YouTube and other players.
A Paraplex chart takes up to 400 rows from a CSV and reads formatted values such as "$1,200" and "45%". For larger datasets, a particle cloud plots up to 10,000 rows as a 3D scatter, one particle per row.
Up to an hour per piece, at 10 to 120 fps. That covers a single stat, a results recap, a narrated Short or a full report video in one piece.
Yes. The free plan includes the full editor and 1080p exports with no watermark, including transparent video so a chart can sit over footage or a slide, and the infographic templates are free. Pro adds 4K at 60 fps and exporting every data variant at once.
Start free in your browser. Upgrade when your work needs 4K.
Paraplex is a browser-based 3D motion design studio with an AI assistant that edits real layers and keyframes.
| Paraplex | Screen Studio | Rotato | A Fiverr freelancer | |
|---|---|---|---|---|
| Runs on | The browser, nothing to install | macOS only | Mac app; web version in public beta | Not applicable |
| Starts from | Your screenshots, screen recordings, SVGs or live code | A recording of your screen | Your screens on 30+ 3D device models | Your brief |
| 3D | Full 3D scenes: devices, glass, chrome, lights, camera moves | Device-frame mockups | 3D device mockups | Depends on the freelancer |
| Cursor | Animated cursor with clicks, taps and drags; seven styles | Smoothed, restyled cursor with click ripples and auto-zoom on clicks | Not listed | Depends on the freelancer |
| Exports | MP4, WebM (alpha on Pro), GIF, PNG, live embed; every aspect ratio from one scene | MP4, GIF | ProRes 4444, H.264 or HEVC up to 8K, PNG frames, web export | As agreed |
| Price | Free (1080p, no watermark); Pro from $19/mo billed yearly | $9/mo billed yearly, or $29 month to month | One-time purchase tiers | $40 to $350 per app promo, across 1,000+ gigs |
When to pick something else. If all you need is a polished recording of a real product session on a Mac, Screen Studio is the quicker tool; Paraplex's own Record screen adds automatic zooms in any browser and drops the recording straight into your scene. If you want a clickable tour that visitors step through themselves, interactive demo platforms such as Arcade, Storylane and Navattic are built for that. If you want one prompt to return a finished video with little editing, one-prompt tools such as Hera Launch, Motion.so and Pexo aim there. Paraplex is for launch pieces you direct shot by shot, in 3D.
CSS stand-in · LV-03a
CSS stand-in · LV-03b
CSS stand-in · LV-03c
Render needed · LG-00
Shot title
10 s loop · 16:9 · MP4, WebM and poster
Shot brief goes here.
When every new site starts from the same AI-built layout, they start to look alike. The hero is where yours can stand apart. Paraplex builds real 3D scenes lit like a studio, lets them answer the pointer and the scroll, and publishes them as a live embed you paste into any site, with every layer still yours to edit.
Interactions are set in the editor, tried in Preview the way a visitor would, and carried into the embed. Every interactive layer also gets a keyboard-focusable stand-in, so it can be reached with Tab and Enter.
Render needed · WH-02a
Hover
6 s loop · 16:9 with a center-safe 1:1 · Preview recording · MP4, WebM and poster
Chrome & glass hero in Preview. A cursor glides onto the glass card; it lifts and its rim brightens on a spring, then settles as the cursor leaves. Same set and framing in WH-02a to e.
Hover
Give a layer a hover state: its own properties change over a duration you set, springs included.
Render needed · WH-02b
Click
6 s loop · 16:9 with a center-safe 1:1 · Preview recording · MP4, WebM and poster
Same scene. The cursor clicks a hotspot and the camera glides to frame the chrome panel; a second click glides it back.
Click
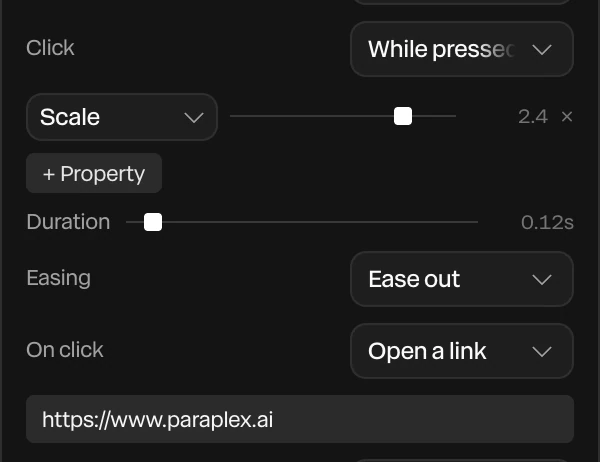
A click can jump to a time, play a range, play or pause, open a link, or glide the camera to a hotspot.
Render needed · WH-02c
Drag
6 s loop · 16:9 with a center-safe 1:1 · Preview recording · MP4, WebM and poster
Same scene. The cursor drags the glass card along X and lets go; a fine white particle field scatters away from the pointer and drifts back.
Drag
Visitors can drag a layer along an axis, and particles can scatter away from the pointer.
Render needed · WH-02d
Scroll
6 s loop · 16:9 with a center-safe 1:1 · Preview recording · MP4, WebM and poster
Same scene inside a plain page. Scrolling down plays the chrome panel's turn forward; scrolling up plays it back.
Scroll
The visitor's scrolling drives the timeline, so the scene plays forward and back as the page moves.
Render needed · WH-02e
Camera
6 s loop · 16:9 with a center-safe 1:1 · Preview recording · MP4, WebM and poster
Same scene with Orbit on. The cursor drags and the camera circles the pair, so studio reflections slide across the glass and chrome.
Camera
Let visitors Orbit the scene, Look around it like a panorama, Walk through it with W A S D, or keep the camera Fixed.
The assistant can draft the scene, but nothing goes live until you've seen it, and every part of it stays yours to change. Each step below is a tool in the editor.
01
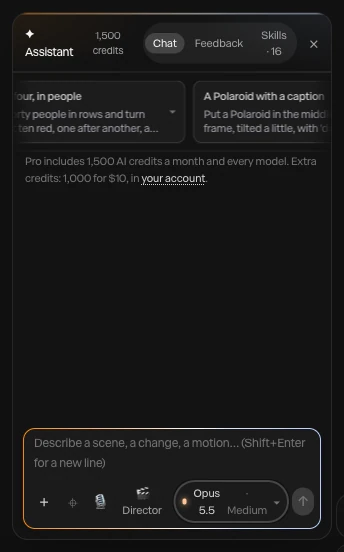
Type what you want, such as a chrome panel turning behind a frosted glass card, or attach a screenshot or video to build from. The AI motion design assistant builds it with the editor's own layers, keyframes, lights and camera moves, using 140 tools, and every turn is a preview you Apply or Discard.
Render needed · WH-03a
Describe it
6 to 8 s loop · 9:16 crop of a screen recording · MP4, WebM and poster
A one-line prompt for a website hero typed into the assistant; layers appear as the scene builds; Apply.
02
The assistant renders the piece at up to six moments and checks that everything is in frame and the type is readable. What it makes stays ordinary layers and keyframes: retime a move by hand, swap a material, or click layers with Point at it and ask for a change. Each applied turn undoes in one step.

Render needed · WH-03b
Change anything
6 to 8 s loop · 9:16 crop of a screen recording · MP4, WebM and poster
Point at it: two layers clicked on the canvas and a change requested, then one keyframe dragged by hand on the timeline.
03
Give layers hover and click states, let them be dragged, let scrolling drive the timeline, or build a state machine with an idle loop and a press. Then open Preview and try it the way a visitor will, with hover, click, drag and scroll all working.
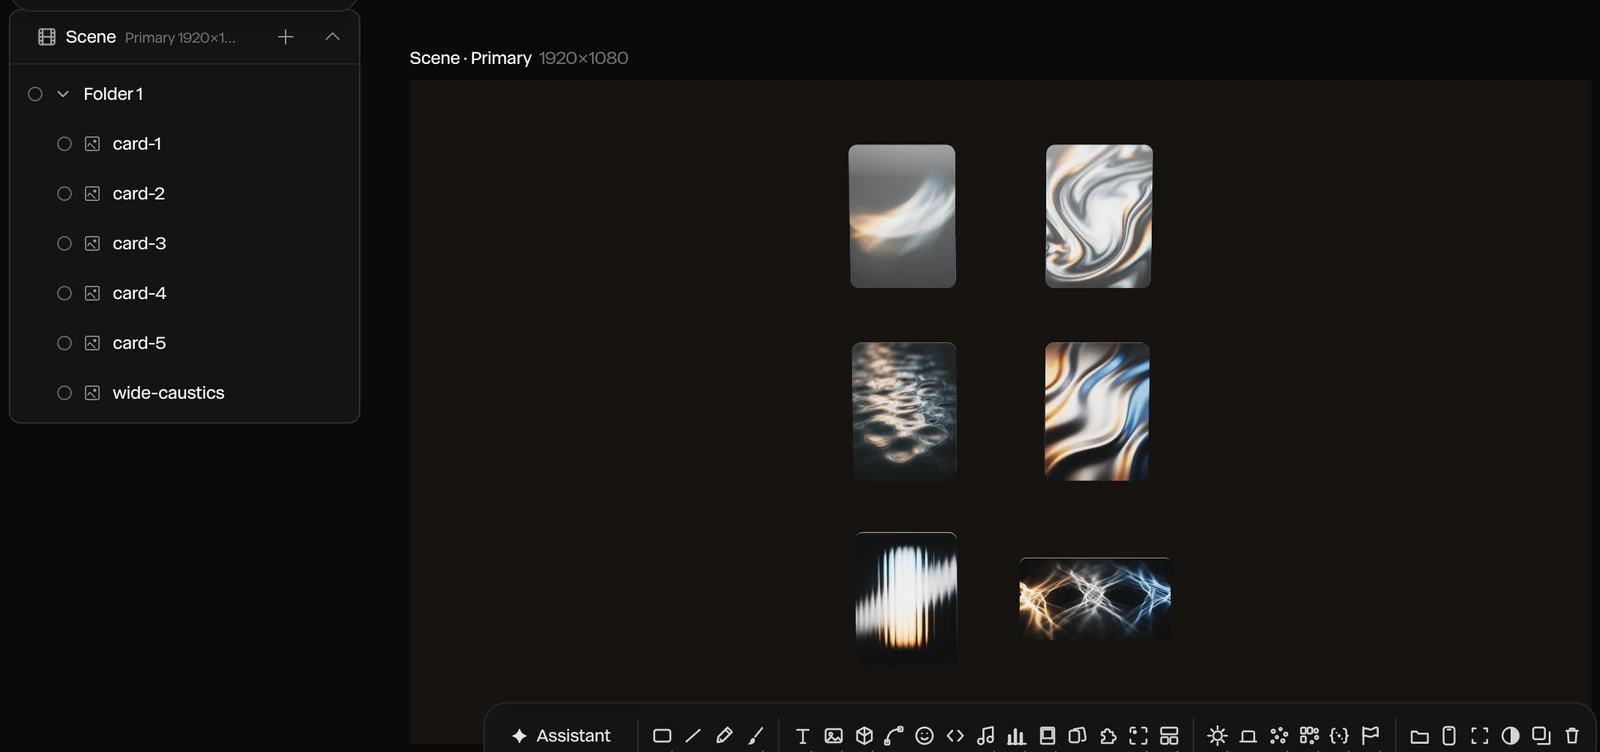
Render needed · WH-03c
Add interactions
6 to 8 s loop · 9:16 crop of a screen recording · MP4, WebM and poster
A hover state added to the glass card in the properties panel, then Preview: the cursor hovers, clicks and scrolls, and the scene answers each time.
04
Publish embed gives you a snippet that puts the live scene on any website, playing in real time. Paste it into your page, and breakpoints let the embed pick an artboard by page width, so one hero fits desktop and phone layouts.
Render needed · WH-03d
Publish and paste
6 to 8 s loop · 9:16 crop of a screen recording · MP4, WebM and poster
Publish embed, the snippet copied, then pasted into a site builder's embed element; the live hero appears on the page.
A Paraplex hero isn't a video file you host. It's the live scene, published once and placed with a snippet wherever your site builder takes custom code. Breakpoints pick the right artboard for each screen.

Webflow

Framer
Any HTML page
Render needed · WH-04a
Webflow, phone
6 to 8 s loop · 9:16 phone screen recording · MP4, WebM and poster
A published Webflow page whose hero is the Chrome & glass hero embed; the vertical artboard is picked by breakpoint and a thumb scroll plays the scene.
A Webflow page at phone width
Render needed · WH-04b
Framer, phone
6 to 8 s loop · 9:16 phone screen recording · MP4, WebM and poster
The same embed in a published Framer site; a tap on the glass card plays its press state.
The same hero in a Framer site
Render needed · WH-04c
Plain HTML, phone
6 to 8 s loop · 9:16 phone screen recording · MP4, WebM and poster
The same embed pasted into a bare HTML page; a two-finger drag orbits the camera.
And in a plain HTML page
Publish embed gives you the snippet
Paste it where your site takes custom code: a Code Embed in Webflow, an Embed in Framer
Or into the HTML of any page
Breakpoints pick an artboard by page width
Responsive framing re-stacks blocks for each shape
Sizes in vw, vh and percent follow each artboard
Fill a headline, a number, a color or a picture by layer name
Switch Light and Dark themes live
Send inputs to a state machine, or pass scroll progress
Concept render
Live code, inside the scene.
Paste HTML, a React component or a shadcn/ui component as a code layer. Inside an embed it runs live and responds to the pointer.
Concept render

Lit like a studio.
Eleven environments, eight HDRI panoramas and a one-click 3-point setup, with soft shadows and real reflections.
Concept render

Every keyframe stays open.
Templates and the assistant build ordinary layers and keyframes you can retime by hand.
Concept render

Real glass and chrome.
Physical glass bends and frosts whatever sits behind it, with refraction and dispersion, and Liquid glass panes split the light at their rims.
Render needed · LG-00
Shot title
10 s loop · 16:9 · MP4, WebM and poster
Shot brief goes here.
A library of 26 effects works on the whole frame or on the logo alone, every dial keyframeable: glitch, RGB shift, chromatic aberration, VHS, datamosh, pixelate, ripple and dissolve among them. Text can Glitch in or Decode, flickering through random characters before it settles.
A Light sweep runs a bright band across chrome, Emit light makes the mark glow and light what's around it, and 18 scene transitions such as Flash frame, Glow in and Burn in open or close the sting. The Glitch title template is playing here.
Render needed · LA-02d
Fade, staggered
4 s loop · 16:9 · MP4, WebM and poster
Same set. A mark built from four chrome parts fades in part by part with a stagger, then the wordmark fades up beneath it.
Fade with a stagger · part by part
Render needed · LA-02e
Tracking in
4 s loop · 9:16 · MP4, WebM and poster
Same set. The wordmark closes in from wide letter spacing to its set tracking as a Light sweep crosses the chrome symbol above it.
Tracking in · letters close from wide spacing

Render needed · LA-02f
Glitch in
4 s loop · 1:1 · MP4, WebM and poster
Same set. The wordmark Glitches in and holds, then exits the same way; keep the RGB split brief and small so the frame stays near-monochrome.
Glitch in · and out again as the exit
Render needed · PD-02a
Click
4 s loop · 16:9 · MP4, WebM and poster
Shared set for PD-02a to c: a light-chrome browser frame with a neutral app screen on graphite, white softbox key. A macOS cursor glides in with a slight overshoot, dips and pulses on a button, which presses in; click sound on.
Render needed · PD-02b
Drag
4 s loop · 9:16 · MP4, WebM and poster
Same set at phone width. The hand cursor closes on a card, presses and drags it to a new column, then opens as it lets go; the other cards reflow.
Render needed · PD-04
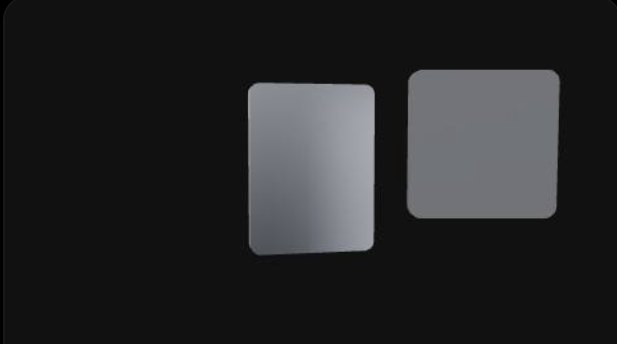
Push in on each click
8 s loop · 16:9 · MP4, WebM and poster
A minimal browser frame on a graphite seamless. A macOS cursor clicks three controls in turn; on each click the camera Pushes in on a spring, holds, then Pulls back. Shallow depth of field keeps only the active step sharp. Graded near-monochrome.

Render needed · PD-05
Data variants for three prospects
8 s · 16:9 screen recording · MP4, WebM and poster
A spreadsheet with three invented companies (name, logo, one metric) is imported into a demo scene; Data variants shows the three versions side by side, then Export all variants starts. Invented brands only; dark editor UI.
Render needed · PD-06
Re-skin a demo in one step
6 to 8 s · 16:9 screen recording · MP4, WebM and poster
The Cursor tour template opens; a design system for an invented SaaS brand (palette, font, logo in Brand assets) is applied in one step, and the dashboard, caption chips and title re-skin while every keyframe stays put.

Render needed · DV-01
A data cloud from a spreadsheet
6 s loop · 1:1 · MP4, WebM and poster
A 600-row sample CSV bound to a particle cloud on a graphite seamless: white points stream in and settle into a slowly turning 3D scatter, sized by one column. One cluster takes a warm amber key; everything else stays white. "Sample data" in a corner.